@GossiTheDog
Yes, but also no. Using the S1, I get this graph.
===
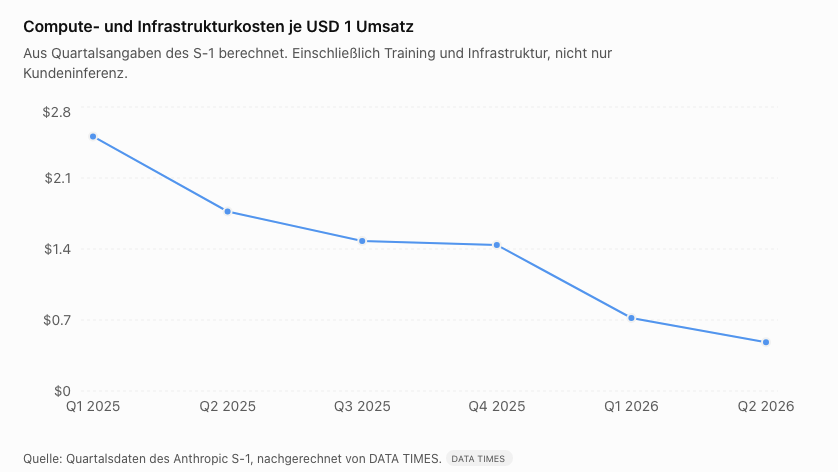
Line chart titled “Compute- und Infrastrukturkosten je USD 1 Umsatz” (compute and infrastructure costs per USD 1 of revenue). Subtitle: “Aus Quartalsangaben des S-1 berechnet. Einschließlich Training und Infrastruktur, nicht nur Kundeninferenz.”
The y-axis shows cost per dollar of revenue, labeled from $0 to $2.8 in $0.7 steps. The x-axis shows six quarters: Q1 2025, Q2 2025, Q3 2025, Q4 2025, Q1 2026, Q2 2026.
The line shows a clear downward trend. It begins at its highest point of about $2.8 in Q1 2025, falls to roughly $1.8 in Q2 2025, then to about $1.5 in Q3 2025, stays nearly flat at about $1.4–$1.5 in Q4 2025, drops sharply to about $0.7 in Q1 2026, and ends at its lowest point of about $0.5 in Q2 2026.
Main takeaway: the compute and infrastructure cost per dollar of revenue declines steadily over the period, falling from about $2.8 to about $0.5.
Source line at the bottom: “Quelle: Quartalsdaten des Anthropic S-1, nachgerechnet von DATA TIMES.” with the “DATA TIMES” label.